Data Visualisation Portfolio
WEEK 1: Building a site and embedding charts
WEEK 2: Hosting data
Form an API
From GitHub
WEEK 3: Editing data, writing JSON by hand
Chart with an added observation
Random observations JSON
WEEK 4: API driven charts
Below are two API driven charts. The first chart shows the USD/GBP exchange rate in 2000-2021, it fetches data from FiscalData.Treasury.gov via API. The second chart shows crimes at Durdham Downs by type of offense, it gets data from the UK police API
WEEK 5: Loops and APIs
Data downloaded from FRED API using Python. See the relevant Colab notebook here
WEEK 6: Reading Week
WEEK 7: Scrapers
Scraped from the Business Insider website. See the relevant Colab notebook here
WEEK 8: Data Stories
At the "Talking Economics" conference on 18 November Zsoka Koczan said that oil prices have rebounded after the Covid shock. This is true, as evident from the chart below. Crude oil price has reached 83 dollars per barrel in November 2021, the highest value since mid-2019.
WEEK 9: Advanced Analytics
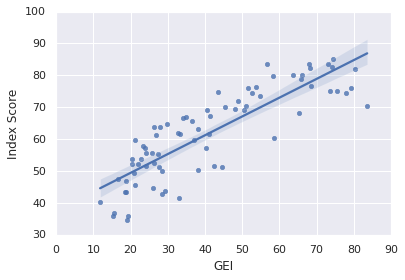
Regressing Social Mobility Index on Global Entrepreneurship Index using regplot Seaborn function in Colab. See the relevant Colab notebook here.
WEEK 10: Interactivity
In this scatter plot I am using a dropdown box and a tooltip for interactivity.